amep.utils.profile#
- amep.utils.profile(coords: ndarray, box_boundary: ndarray, values: ndarray, binwidth: float = 10.0, axis: str = 'x', return_indices: bool = False) tuple[ndarray, ndarray, ndarray]#
Calculate the profile of given values.
Work per particle along the given axis of the simulation box.
- Parameters:
coords (np.ndarray) – Coordinate frame.
box_boundary (np.ndarray of shape (3,2)) – Boundary of the simulation box in the form of np.array([[xmin, xmax], [ymin, ymax], [zmin, zmax]]).
values (np.ndarray) – Per-particle values (1D array).
binwidth (float, optional) – Width of the distance bins along the given axis. The default is 10.0.
axis (str, optional) – Axis along which the profile should be calculated. The default is ‘x’.
return_indices (bool, optional) – If True, for each bin the indices of included particles are returned. The default is False.
- Returns:
np.ndarray – Profile of the given values (=average of values of the particles in each bin).
np.ndarray – Bin positions.
np.ndarray – Object array of lists of indices for each bin giving the particle indices of all particles inside the specific bin.
Examples
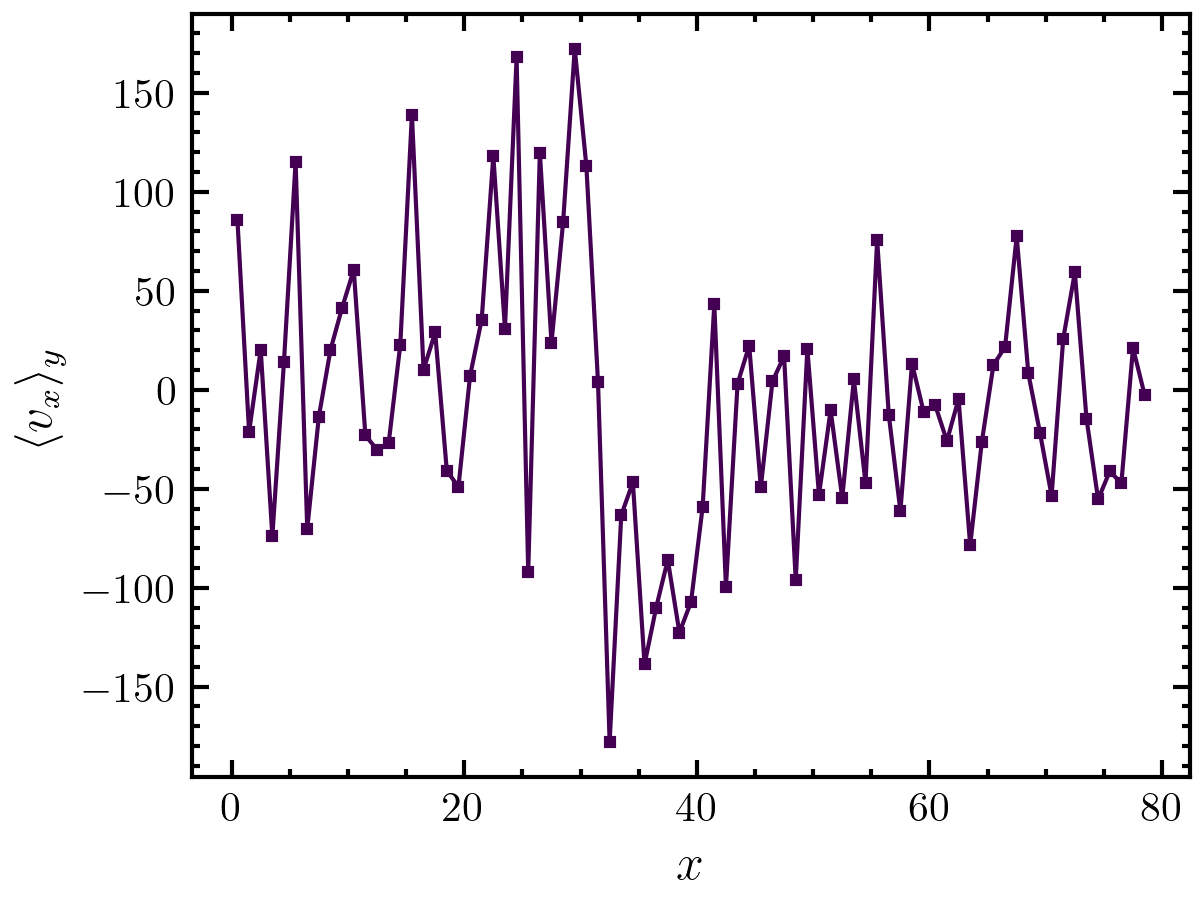
Here, we calculate the x-velocity profile along the x direction:
>>> import amep
>>> traj = amep.load.traj("../examples/data/lammps.h5amep")
>>> frame = traj[-1]
>>> y, x = amep.utils.profile(
...     frame.coords(), frame.box, frame.data("vx"),
...     binwidth=1, axis='x'
... )
>>> fig, axs = amep.plot.new()
>>> axs.plot(x, y)
>>> axs.set_xlabel(r'$x$')
>>> axs.set_ylabel(r'$\langle v_x\rangle_y$')
>>> fig.savefig('./figures/utils/utils-profile_1.png')
>>>

