amep.plot.animate_trajectory#
- amep.plot.animate_trajectory(trajectory: FieldTrajectory | ParticleTrajectory, outfile: Path | str, ptype: int | None = None, ftype: str | None = None, xlabel: str = '', ylabel: str = '', cbar_label: str = '', cbar: bool = True, formatter: Callable[[Axes], None] | None = None, painter: object | None = None, title: str = '', figsize: tuple[float, float] | None = None, start: float = 0.0, stop: float = 1.0, nth: int = 1, fps: int = 10, verbose: bool = False, **kwargs) None#
Create a video from a trajectory.
Quick video writeout. Just takes a trajectory and animates it. For further customization of videos, check the amep.plot.create_video method.
Note for Field: The box must have the same size for the whole trajectory.
- Parameters:
trajectory (FieldTrajectory or ParticleTrajectory) – An AMEP-Trajectory object containing the data to be animated. If you give a ParticleTrajectory your dataset needs to contain radii for the particles under the key “radius”. If you provide a FieldTrajectory, the data must be 2D.
outfile (str or Path) – A path for the animation to be written to.
ptype (int or None, optional) – The particle types to be visualized. This value is only used if a ParticleTrajectory is provided. The default is None.
ftype (str or None, optional) – The field to be visualized. This value is only used if a FieldTrajectory is provided. The default is None.
xlabel (str, optional) – Label for the x axis. The default is ‘’.
ylabel (str, optional) – Label for the y axis. The default is ‘’.
cbar_label (str, optional) – Label for the colorbar. The default is ‘’.
cbar (bool, optional) – If True, a colorbar is shown. If ParticleTrajectory is provided, the colorbar is only shown if also a painter function is provided. The default is True.
formatter (object or None, optional) – A function that takes an axis as input and formats the given axis. For example, use formatter=lambda x: amep.plot.format_axis(x) to format the axis of the video frames. The default is None.
painter (object or None, optional) – A function that calculates the values used to color the particles. This argument is only considered if a ParticleTrajectory is provided. The function must take two positional arguments, first, a BaseFrame object, and second, a particle type (int or None). For example, to color the particles by their ID, use painter=lambda f,p: f.ids(ptype=p). The default is None.
figsize (tuple[float, float]) –
Figure size for the video.
- Note:
If the video changes in size during the animation, adapt the figure size. (Colorbars with long (changing) axis labels need padding.)
Default is (7,5).
start (float, optional) – Fraction of the trajectory at which to start animate the data. Must be smaller than stop. The default is 0.0.
stop (float, optional) – Fraction of the trajectory at which to stop animate the data. Must be larger than start. The default is 1.0.
nth (int, optional) – Use each nth frame to make the animate. The default is 1.
fps (int, optional) – The frames per second of the video. The default is 10.
verbose (bool, optional) – If True, runtime information is printed. The default is False.
**kwargs – All additional keyword arguments are forwared to amep.plot.particles if a ParticleTrajectory is provided and to amep.plot.field if a FieldTrajectory is provided.
- Return type:
None
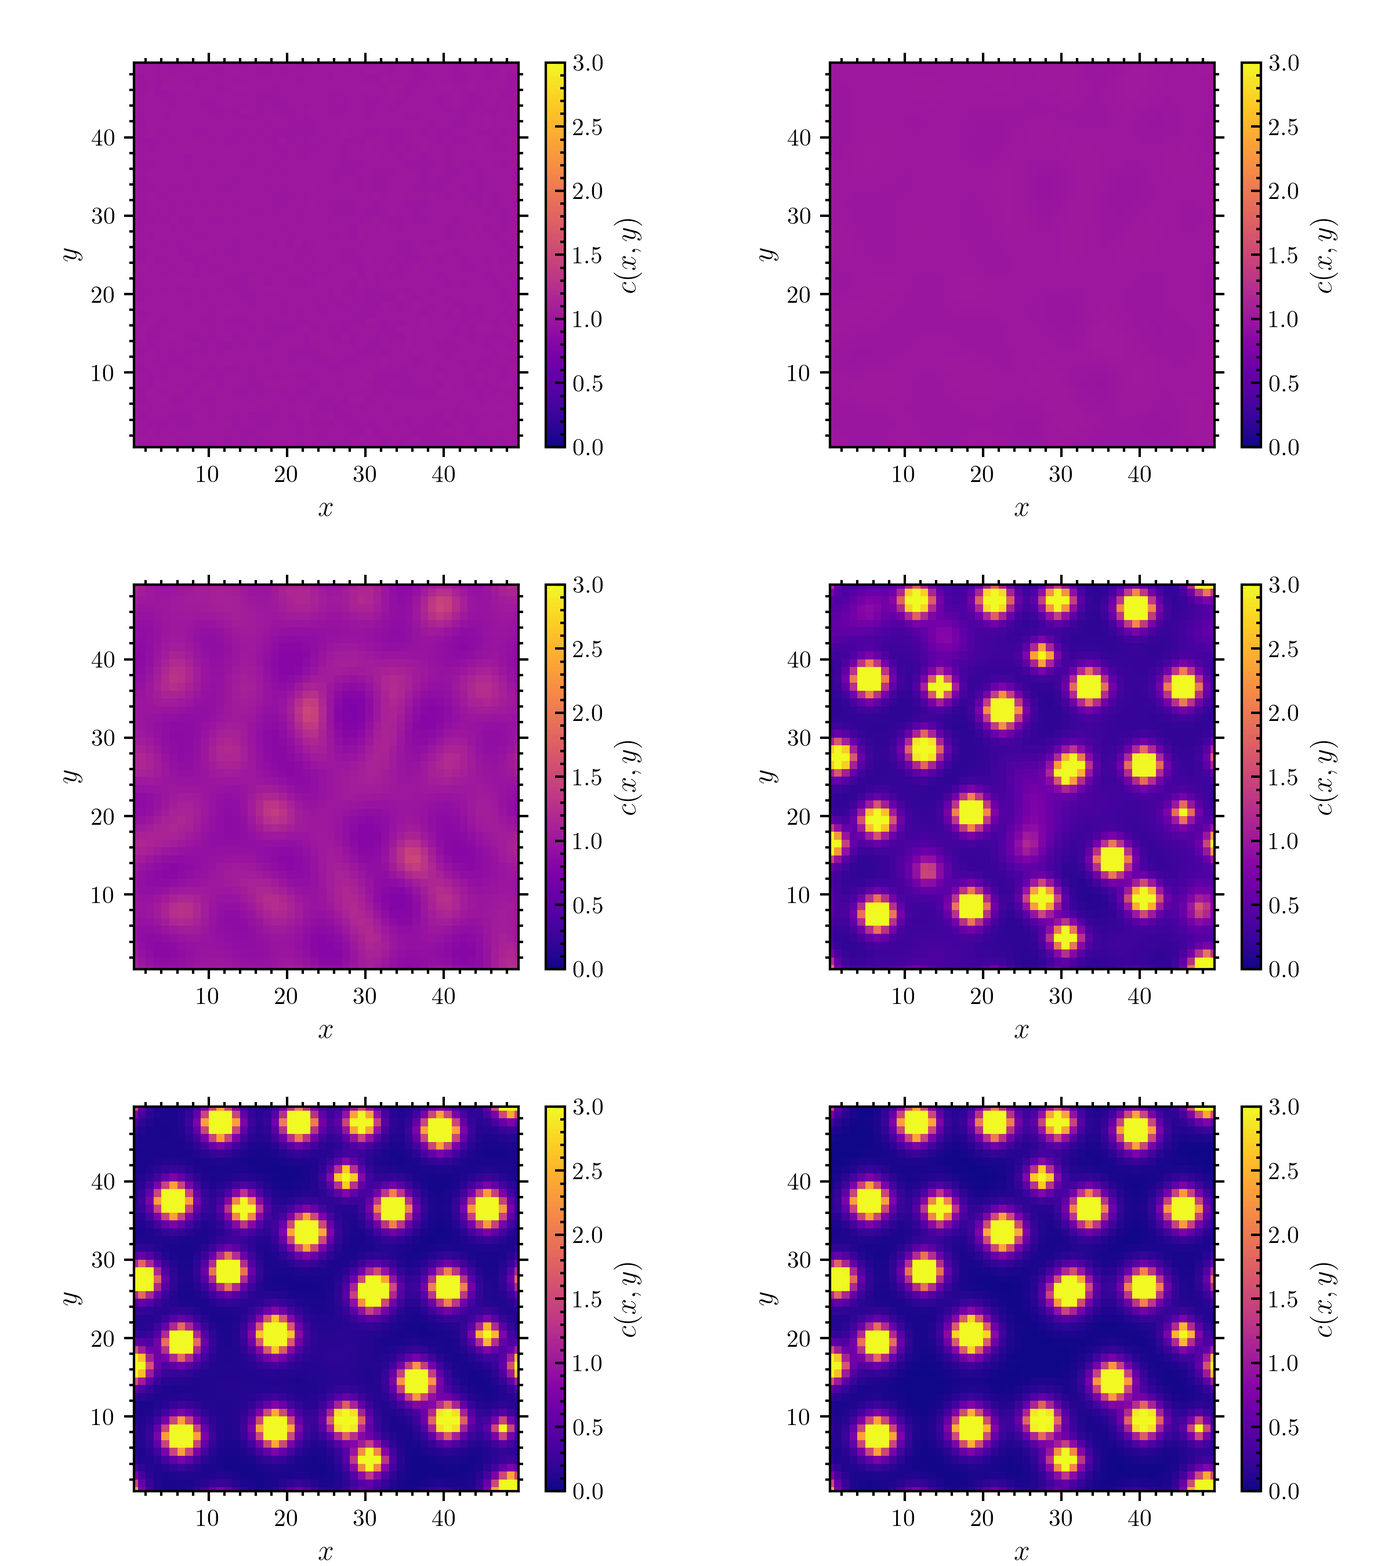
Example
>>> import amep
>>> traj = amep.load.traj("../examples/data/continuum.h5amep")
>>> amep.plot.animate_trajectory(
...     traj, "./figures/plot/plot-animate_trajectory_1.gif",
...     formatter=lambda x: amep.plot.format_axis(x, direction="out"),
...     vmin=0.0, vmax=3.0, ftype='c', xlabel=r"$x$", ylabel=r"$y$",
...     cbar_label=r"$c(x,y)$"
... )
>>>

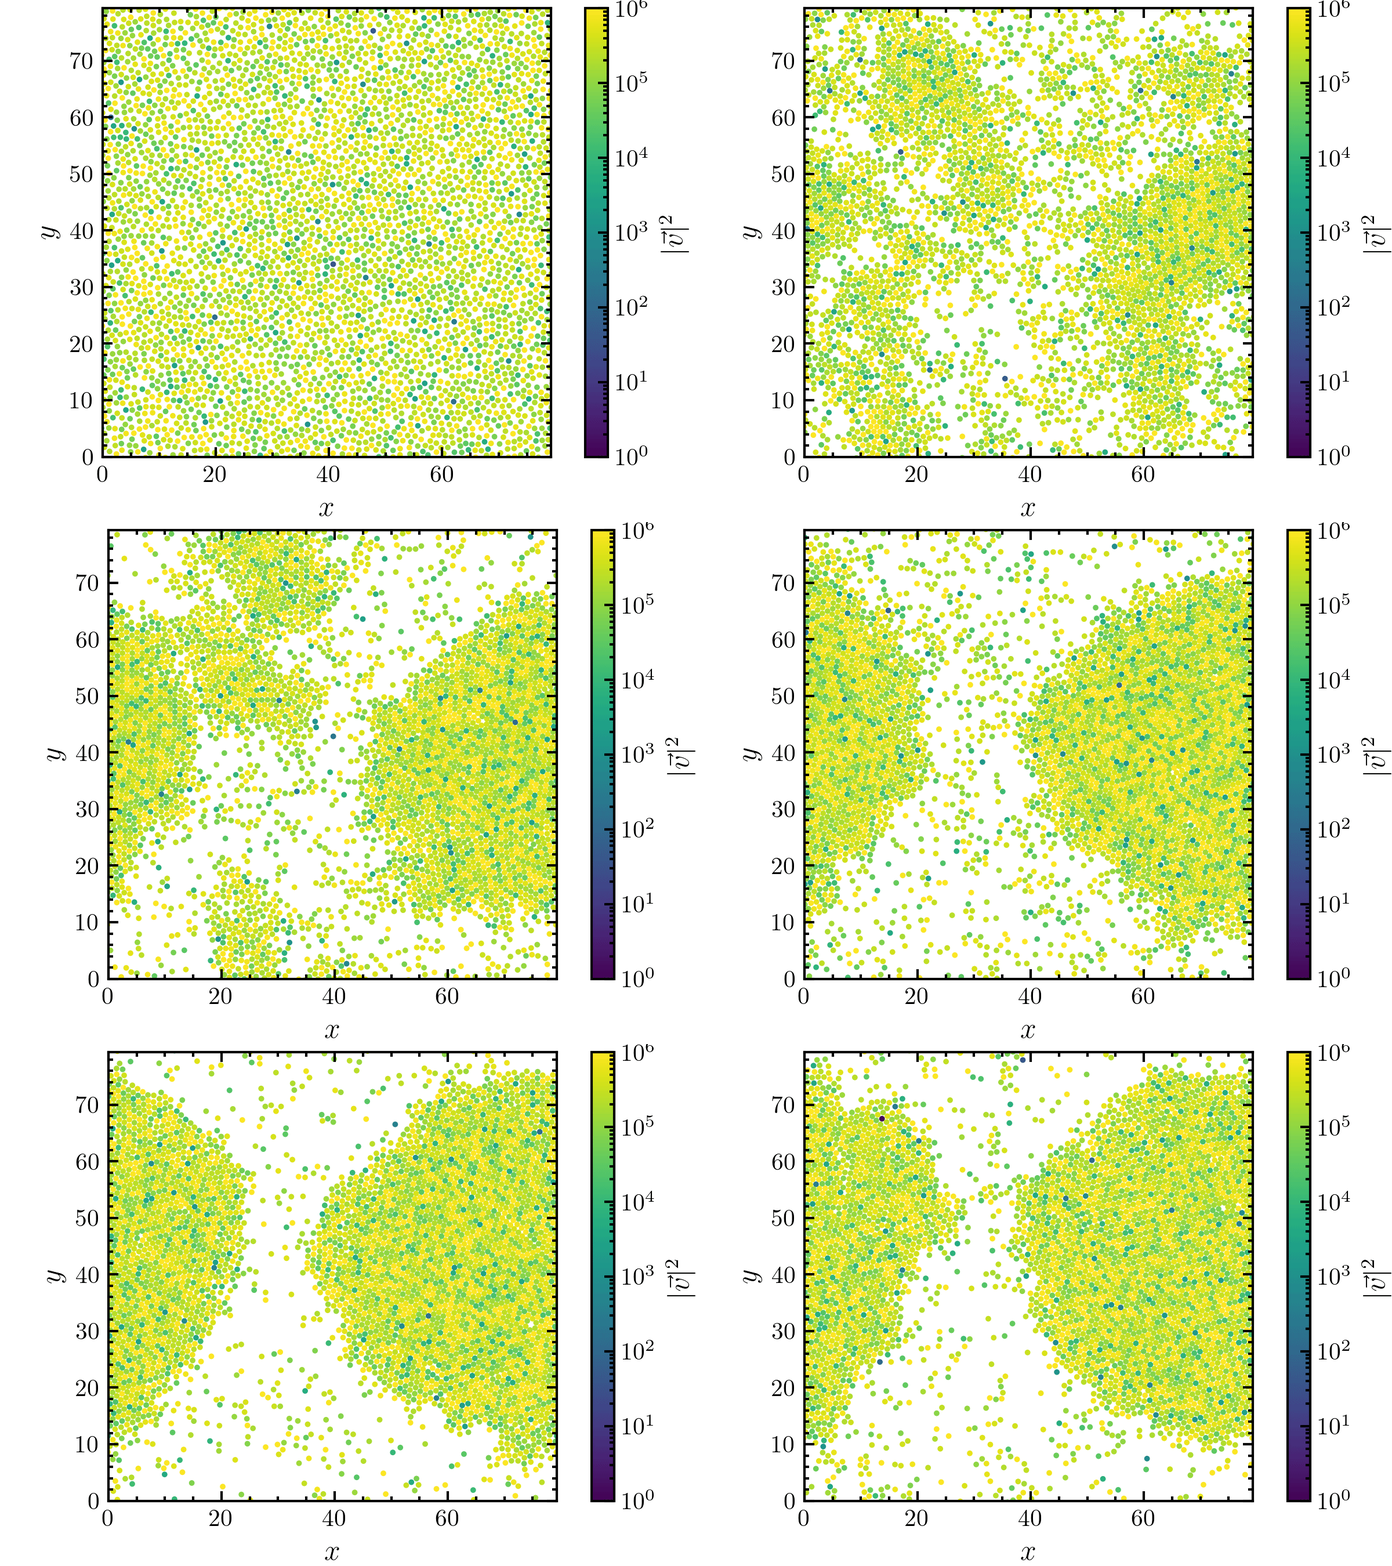
>>> traj = amep.load.traj("../examples/data/lammps.h5amep")
>>> amep.plot.animate_trajectory(
...     traj, "./figures/plot/plot-animate_trajectory_2.gif",
...     painter=lambda x,p: (x.velocities(ptype=p)**2).sum(axis=1),
...     xlabel='x', ylabel='y', cbar_label=r'$|\vec{v}|^2$',
...     vmin=1e0, vmax=1e6, cscale="log"
... )
>>>

