amep.plot.colored_line#
- amep.plot.colored_line(axis: Axes, x_vals: ndarray, y_vals: ndarray, cols: ndarray | None = None, cmap: str | None = None, vmin: float | None = None, vmax: float | None = None, norm=None, linewidth: float = 2) Collection#
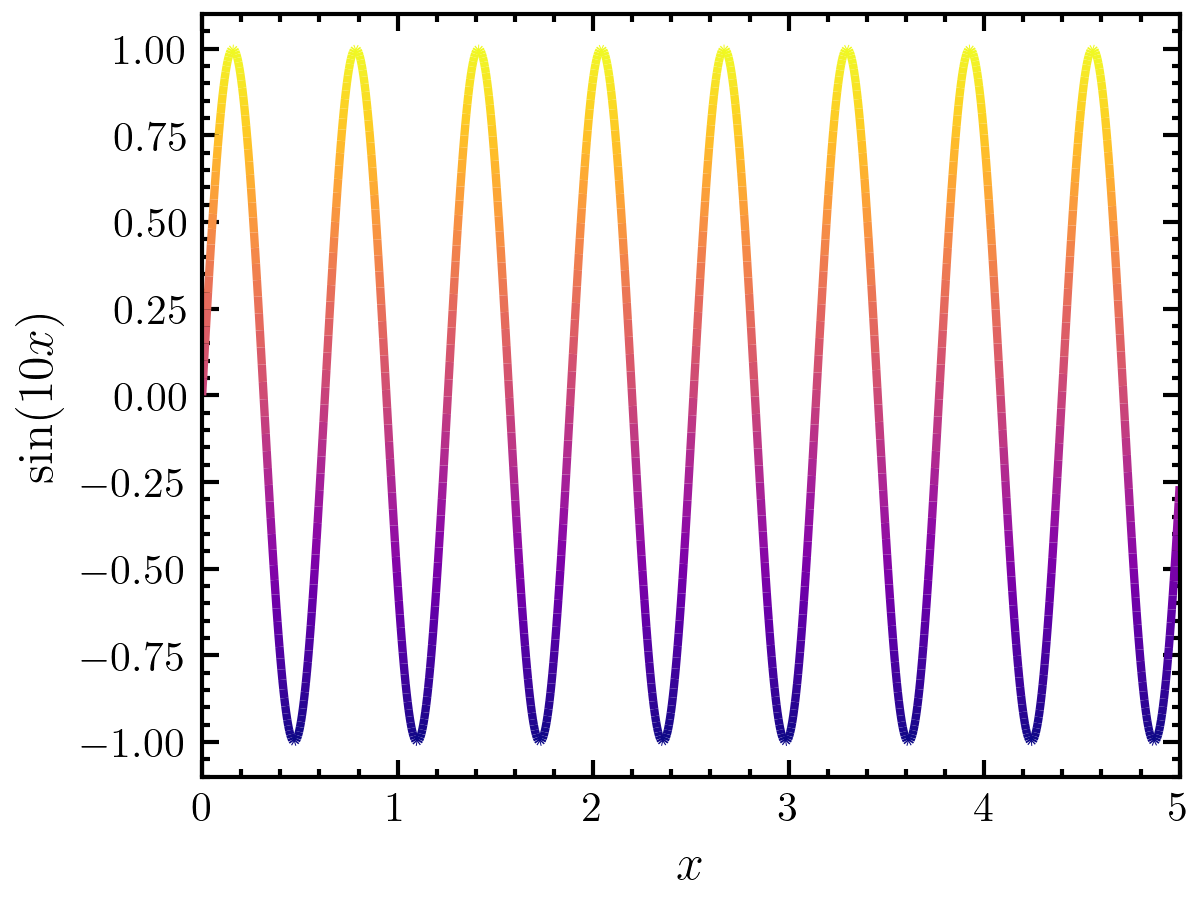
Add a line to the given axis.
The line is colored via the given colormap and the c values.
- Parameters:
axis (AxisSubplot) – Matplotlib.pyplot AxisSubplot object..
x (np.ndarray) – Array of x-values.
y (np.ndarray) – Array of y-values.
c (np.ndarray, optional) – Coloring values. The default is None.
cmap (str, optional) – Colormap name. Available colormaps can be viewed with amep.plot.colormaps(). The default is None.
vmin (float, optional) – Minimum value for colormap normalization. The default is None.
vmax (float, optional) – Maximum value for colormap normalization. The default is None.
norm (Norm, optional) – Normalization. The default is None.
linewidth (int, optional) – Line width. The default is 2.
- Returns:
line
- Return type:
mpl.collections.Collection
Examples
>>> import amep
>>> fig, axs = amep.plot.new()
>>> x = np.linspace(0,5,1000)
>>> y = np.sin(10*x)
>>> line = amep.plot.colored_line(axs, x, y)
>>> axs.set_xlim(0, 5)
>>> axs.set_ylim(-1.1, 1.1)
>>> axs.set_xlabel(r'$x$')
>>> axs.set_ylabel(r'$\sin(10x)$')
>>> fig.savefig('./figures/plot/plot-colored_line.png')
>>>

