amep.plot.add_inset#
- amep.plot.add_inset(axis: Axes, indicator_extent: ndarray | list | tuple, inset_extent: ndarray | list | tuple, connections: ndarray | tuple[tuple[int, int], ...] = ((3, 3), (1, 1)), arrow_style: str = '-', show_box: bool = True, show_connections: bool = True, **kwargs) Axes#
Add an inset plot to the existing plot (axis).
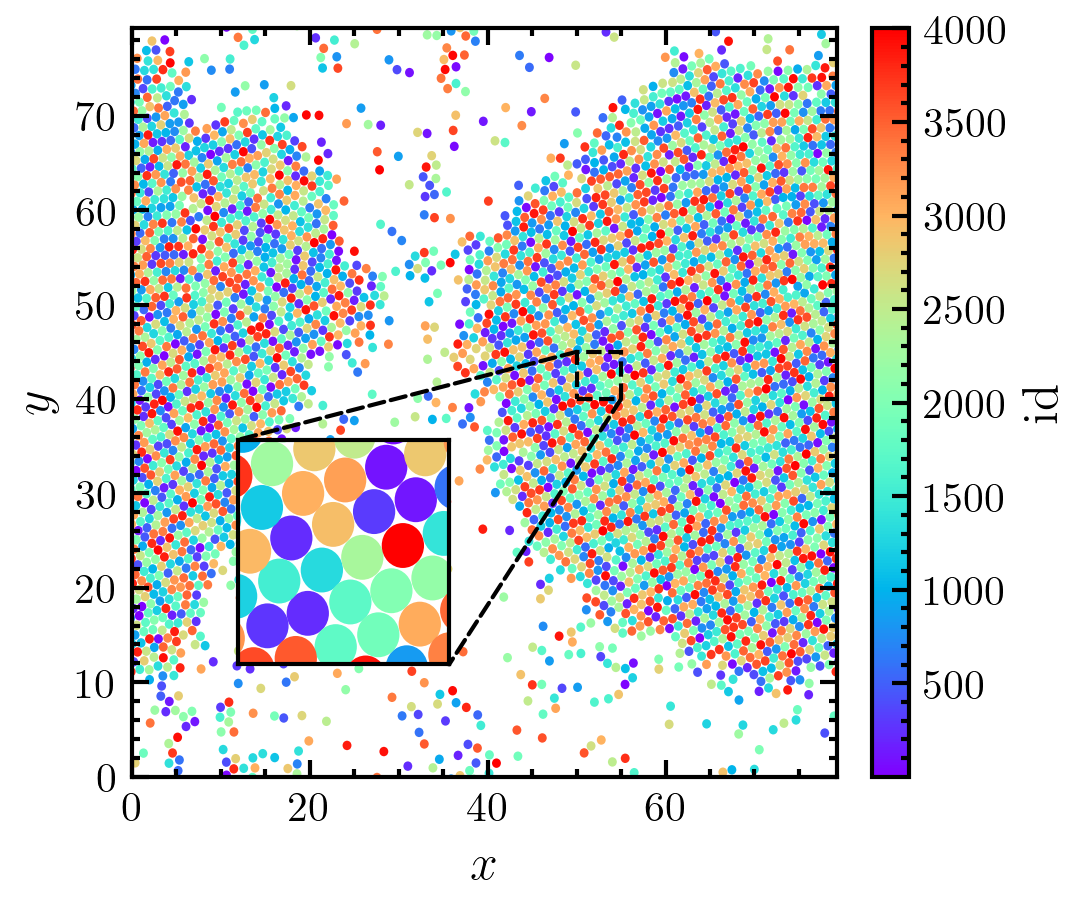
If used in conjunction with plot.particles the keyword set_ax_limits has to be set to False.
- Parameters:
axis (AxisSubplot) – Matplotlib.pyplot AxisSubplot object.
indicator_extent (np.ndarray | list | tuple) –
Absolute coordinates of the area to be enlarged inside the initial plot starting from the lower left corner: [x_0, y_0, d_x, d_y]
- x_0float
x coordinate of the lower left corner of the inset figure.
- y_0float
y coordinate of the lower left corner of the inset figure.
- d_xfloat
Width of the inset figure.
- d_yfloat
Height of the inset figure.
inset_extent (np.ndarray | list | tuple) – The relative coordinates of the patch the zoomlines are pointing too. [x_0, y_0, d_x, d_y] compare indicator_extent
connections (np.ndarray | tuple[tuple[int,int],...], optional) – Defines the corners to be connected for the zoomlines. ((connection_1_start, connection_1_end), (connection_2_start, connection_2_end)) The lower left corner has the index 0, continuing counter-clockwise.
arrow_style (str, optional) – It is used for styling the connection arrow. matplotlib.patches.ArrowStyle Its default type is ‘-‘.
show_box (bool, optional) – If True, the inset box is shown. The default is True.
show_connections (bool, optional) – If True, the connections lines are shown. The default is True.
**kwargs – Addtional keyword arguments are forwarded to the Matplotlib patches [Rectangle](https://matplotlib.org/stable/api/_as_gen/matplotlib.patches.Rectangle.html) and [ConnectionPatch](https://matplotlib.org/stable/api/_as_gen/matplotlib.patches.ConnectionPatch.html).
- Returns:
inset – Matplotlib.pyplot AxisSubplot object of the inset figure.
- Return type:
AxisSubplot
Examples
>>> import amep
>>> import numpy as np
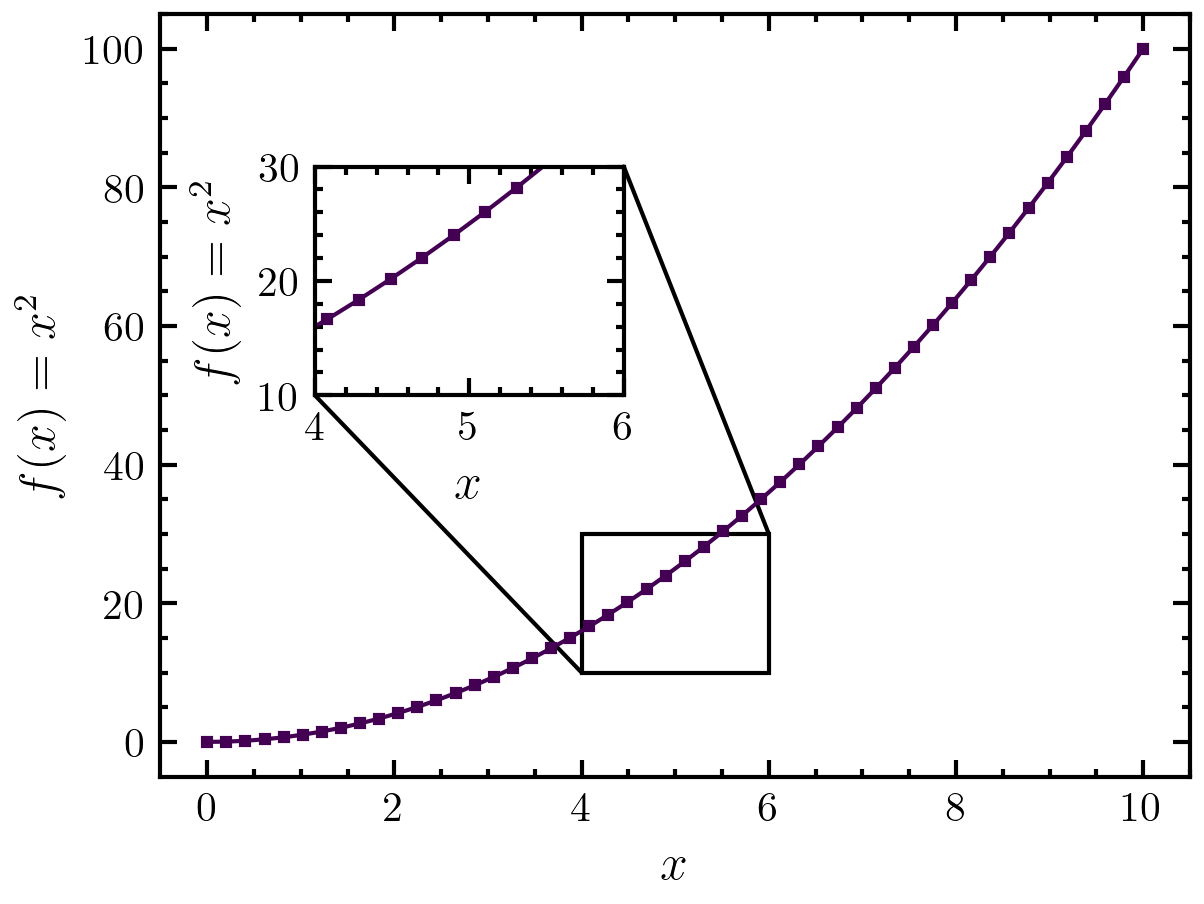
>>> x = np.linspace(0,10)
>>> y = x**2
>>> fig, axs = amep.plot.new()
>>> axs.plot(x, y)
>>> axs.set_xlabel(r"$x$")
>>> axs.set_ylabel(r"$f(x)=x^2$")
>>> inset = amep.plot.add_inset(
...     axs, [4, 10, 2, 20], [0.15, 0.5, 0.3, 0.3],
...     connections = ((0, 0), (2, 2))
... )
>>> inset.plot(x, y)
>>> inset.set_xlabel(r"$x$")
>>> inset.set_ylabel(r"$f(x)=x^2$")
>>> fig.savefig("./figures/plot/plot-add_inset_1.png")
>>>

>>> traj = amep.load.traj("../examples/data/lammps.h5amep")
>>> frame = traj[-1]
>>> fig, axs = amep.plot.new(figsize=(3.6, 3))
>>> mp = amep.plot.particles(
...     axs, frame.coords(), frame.box, frame.radius(),
...     values=frame.ids(), cmap="rainbow"
... )
>>> cax = amep.plot.add_colorbar(fig, axs, mp, label="id")
>>> axs.set_xlabel(r"$x$")
>>> axs.set_ylabel(r"$y$")
>>> inset = amep.plot.add_inset(
...     axs, [50, 40, 5, 5], [0.15, 0.15, 0.3, 0.3],
...     connections=((3, 3), (1, 1)), ls="--"
... )
>>> amep.plot.particles(
...     inset, frame.coords(), frame.box, frame.radius(),
...     values=frame.ids(), cmap="rainbow", set_ax_limits=False
... )
>>> amep.plot.format_axis(inset, ticklabels=False, ticks=False)
>>> fig.savefig("./figures/plot/plot-add_inset_2.png")
>>>

