amep.continuum.gkde#
- amep.continuum.gkde(coords: ndarray, box_boundary: ndarray, weights: ndarray | None = None, bandwidth: float = 1.0, gridpoints: int = 100) tuple[ndarray, ndarray, ndarray]#
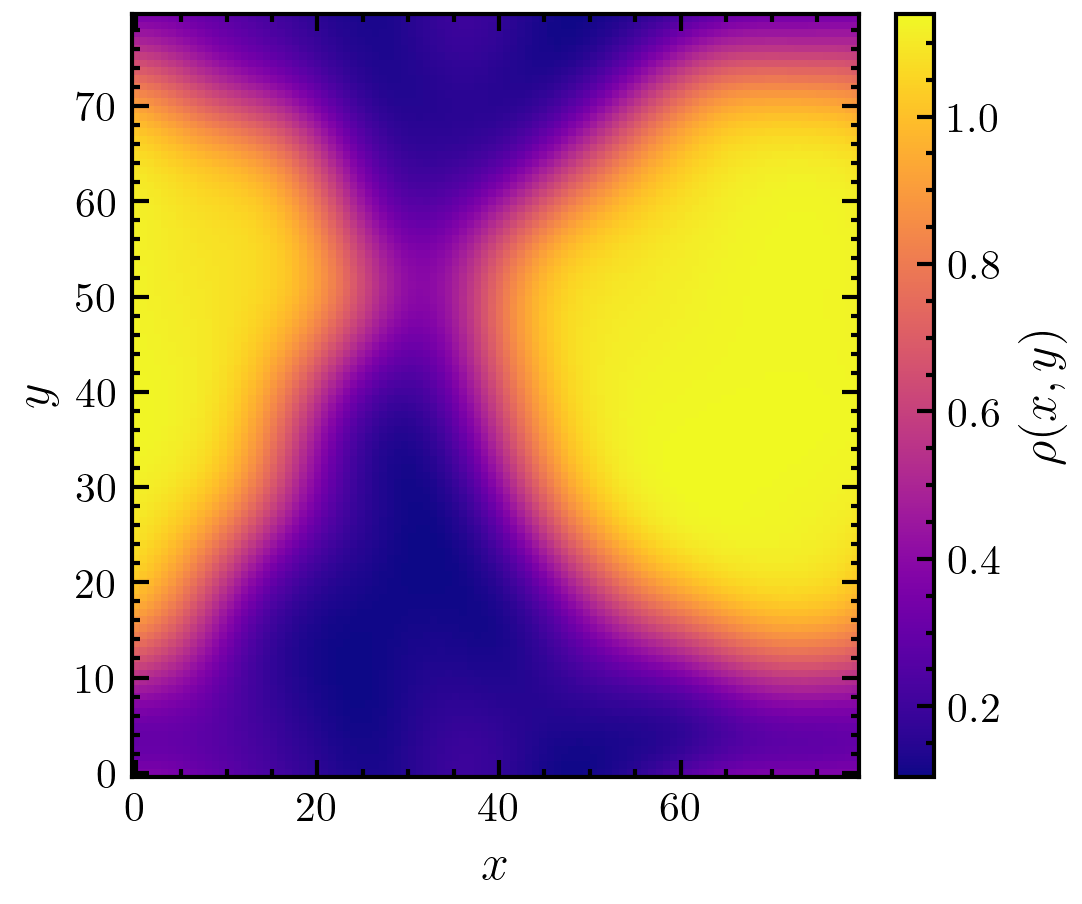
Gaussian Kernel Density Estimation (GKDE).
Uses the kernel density estimation method with a Gaussian kernel to estimate the density field from particle coordinates.
Notes
The Kernel Density Estimation (KDE) method uses a continuous kernel function, which needs to be normalized to one. In KDE, a kernel function k of width h is placed at each position of the particles. Then, all kernel functions are summed to get the final density estimate. There two “parameters”: the form of the kernel function k and its width.
This method is nicely described on page 13 ff. in Ref. [1].
References
- Parameters:
coords (np.ndarray) – Coordinate frame of shape (N,3), which gives the positions of the real particles. The third component is disregarded.
box_boundary (np.ndarray of shape (3,2)) – Boundary of the simulation box in the form of np.array([[xmin, xmax], [ymin, ymax], [zmin, zmax]]).
weights (np.ndarray|None, optional) – Weighting factors for each particle as array of shape (N,). The default is None.
bandwidth (float, optional) – Width of the kernel function. The default is 1.0.
gridpoints (int, optional) – Number of gridpoints in each direction. The default is 100.
- Returns:
d (np.ndarray) – Coarse-grained density field as a two-dimensional array.
X (np.ndarray) – X-components of the grid points as two-dimensional meshgrid.
Y (np.ndarray) – Y-components of the grid points as two-dimensional meshgrid.
Examples
>>> import amep
>>> traj = amep.load.traj("../examples/data/lammps.h5amep")
>>> frame = traj[-1]
>>> d, X, Y = amep.continuum.gkde(
...     frame.coords(), frame.box, bandwidth=5.0
... )
>>> fig, axs = amep.plot.new(figsize=(3.6,3))
>>> mp = amep.plot.field(
...     axs, d, X, Y
... )
>>> cax = amep.plot.add_colorbar(
...     fig, axs, mp, label=r"$\rho(x,y)$"
... )
>>> axs.set_xlabel(r"$x$")
>>> axs.set_ylabel(r"$y$")
>>> fig.savefig('./figures/continuum/continuum-gkde.png')

