amep.continuum.coords_to_density#
- amep.continuum.coords_to_density(coords: ndarray, box_boundary: ndarray, dmin: float = 1.0) tuple[ndarray, ndarray, ndarray]#
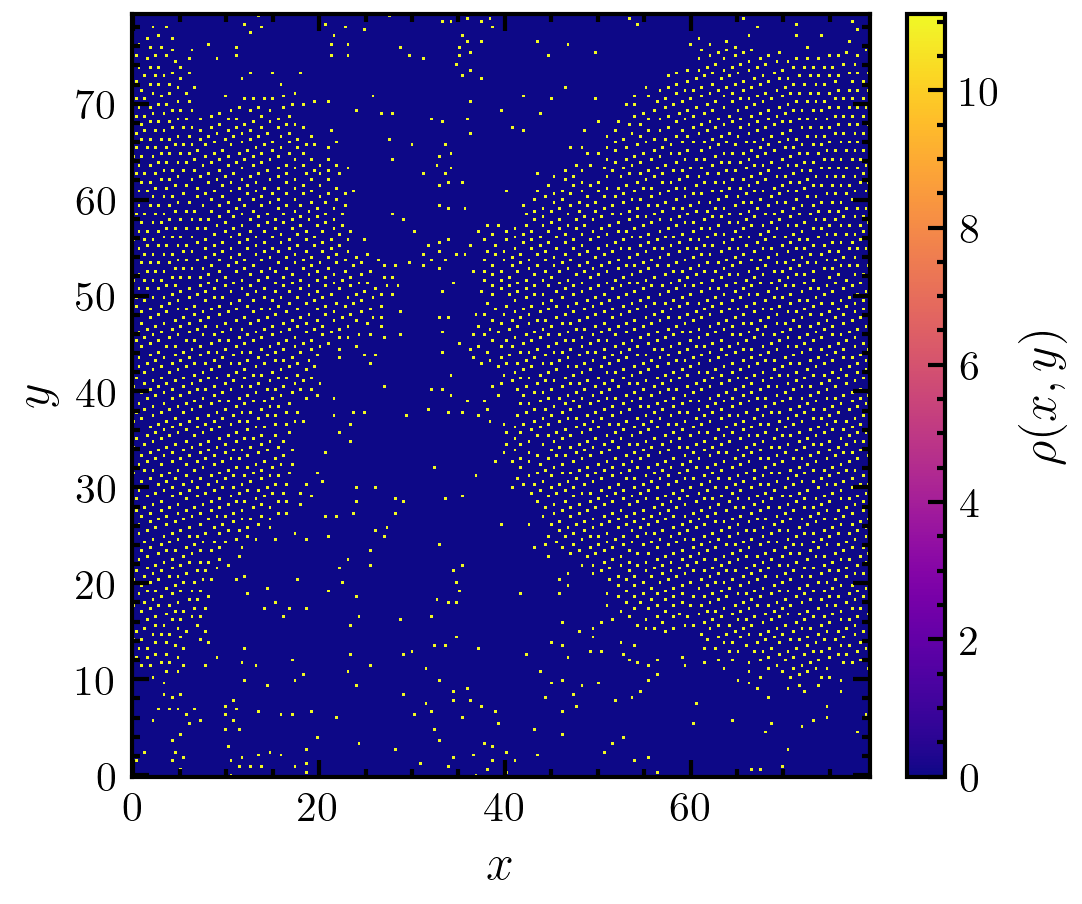
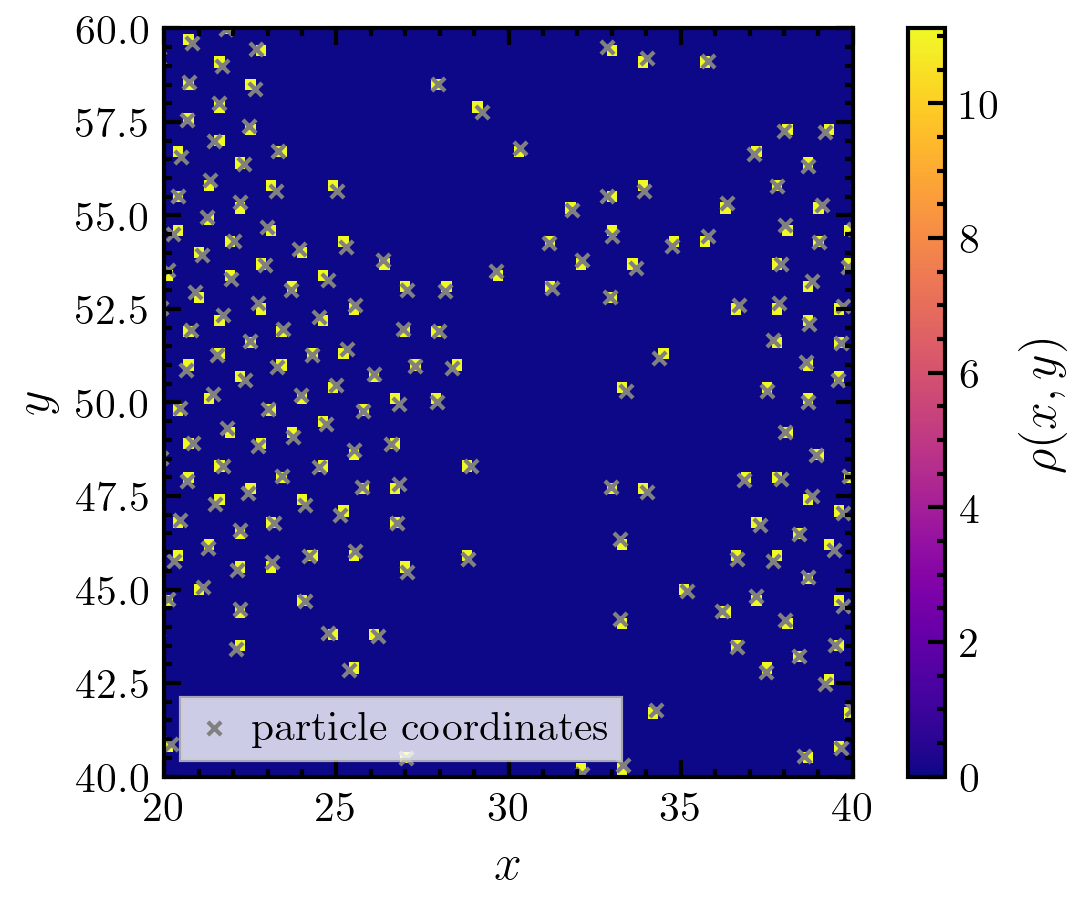
Convert the particle coordinates into a 2D density field.
With size gridsize^2 by calculating a 2D histogram of the x and y coordinates of the particles.
Notes
This version only works in 2D.
To get similar results (e.g., for the structure factor), the size of a grid cell must be smaller or equal to the size of a single particle such that one grid cell cannot be occupied by more than one particle.
- Parameters:
coords (np.ndarray) – Coordinate frame.
box_boundary (np.ndarray of shape (3,2)) – Boundary of the simulation box in the form of np.array([[xmin, xmax], [ymin, ymax], [zmin, zmax]]).
dmin (float, optional) – Minimum grid spacing. Must be smaller than the diameter of the smallest particle in the system. The default is 1.0.
- Returns:
hist (np.ndarray) – Density field.
X (np.ndarray) – x coordinates (same shape as hist; meshgrid).
Y (np.ndarray) – y coordinates (same shape as hist; meshgrid).
Examples
>>> import amep
>>> traj = amep.load.traj("../examples/data/lammps.h5amep")
>>> frame = traj[-1]
>>> d, X, Y = amep.continuum.coords_to_density(
...     frame.coords(), frame.box, dmin=0.3
... )
>>> print('Integrated density: ', int(np.sum(d)*(X[0,1]-X[0,0])*(Y[1,0]-Y[0,0])))
Integrated density:  4000
>>> print('Particle number: ', frame.n())
Particle number:  4000
>>> fig, axs = amep.plot.new(figsize=(3.6,3))
>>> mp = amep.plot.field(axs, d, X, Y)
>>> cax = amep.plot.add_colorbar(
...     fig, axs, mp, label=r"$\rho(x,y)$"
... )
>>> axs.set_xlabel(r"$x$")
>>> axs.set_ylabel(r"$y$")
>>> fig.savefig("./figures/continuum/continuum-coords_to_density_1.png")

>>> fig, axs = amep.plot.new(figsize=(3.6,3))
>>> mp = amep.plot.field(axs, d, X, Y)
>>> cax = amep.plot.add_colorbar(
...     fig, axs, mp, label=r"$\rho(x,y)$"
... )
>>> axs.scatter(
...     frame.coords()[:,0], frame.coords()[:,1], s=10,
...     marker="x", color="gray", label="particle coordinates"
... )
>>> axs.set_xlabel(r"$x$")
>>> axs.set_ylabel(r"$y$")
>>> axs.set_xlim(20, 40)
>>> axs.set_ylim(40, 60)
>>> axs.legend(frameon=True)
>>> fig.savefig('./figures/continuum/continuum-coords_to_density_2.png')

