amep.plot.add_colorbar#
- amep.plot.add_colorbar(fig: Figure, axis: Axes, mappable: ScalarMappable, cax_extent: list | None = None, label: str = '', **kwargs) Axes#
Add a colorbar to an existing plot.
This requires to add a new axis in which the colorbar is shown.
- Parameters:
fig (Figure) – Matplotlib.pyplot figure object.
axis (AxisSubplot) – Matplotlib.pyplot AxisSubplot object to which the colorbar belongs to.
mappable (mappable) – Matplotlib.pyplot mappable (e.g. a scatter plot or PatchCollection).
cax_extent (np.ndarray | list | tuple | None, optional) –
Relative coordinates of the axis on which the colorbar should be plotted starting from the lower left corner: [x_0, y_0, d_x, d_y]
- x_0float
x coordinate of the lower left corner of the inset figure.
- y_0float
y coordinate of the lower left corner of the inset figure.
- d_xfloat
Width of the inset figure.
- d_yfloat
Height of the inset figure.
If None, the colorbar is bound to the given axis. The default is None.
label (str, optional) – Axis label. The default is ‘’.
**kwargs – All other keyword arguments are forwared to fig.colorbar.
- Returns:
cax – Colorbar axis.
- Return type:
AxesSubplot
Examples
>>> import amep
>>> traj = amep.load.traj("../examples/data/continuum.h5amep")
>>> frame = traj[-1]
>>> X,Y = frame.grid
>>> C = frame.data('c')
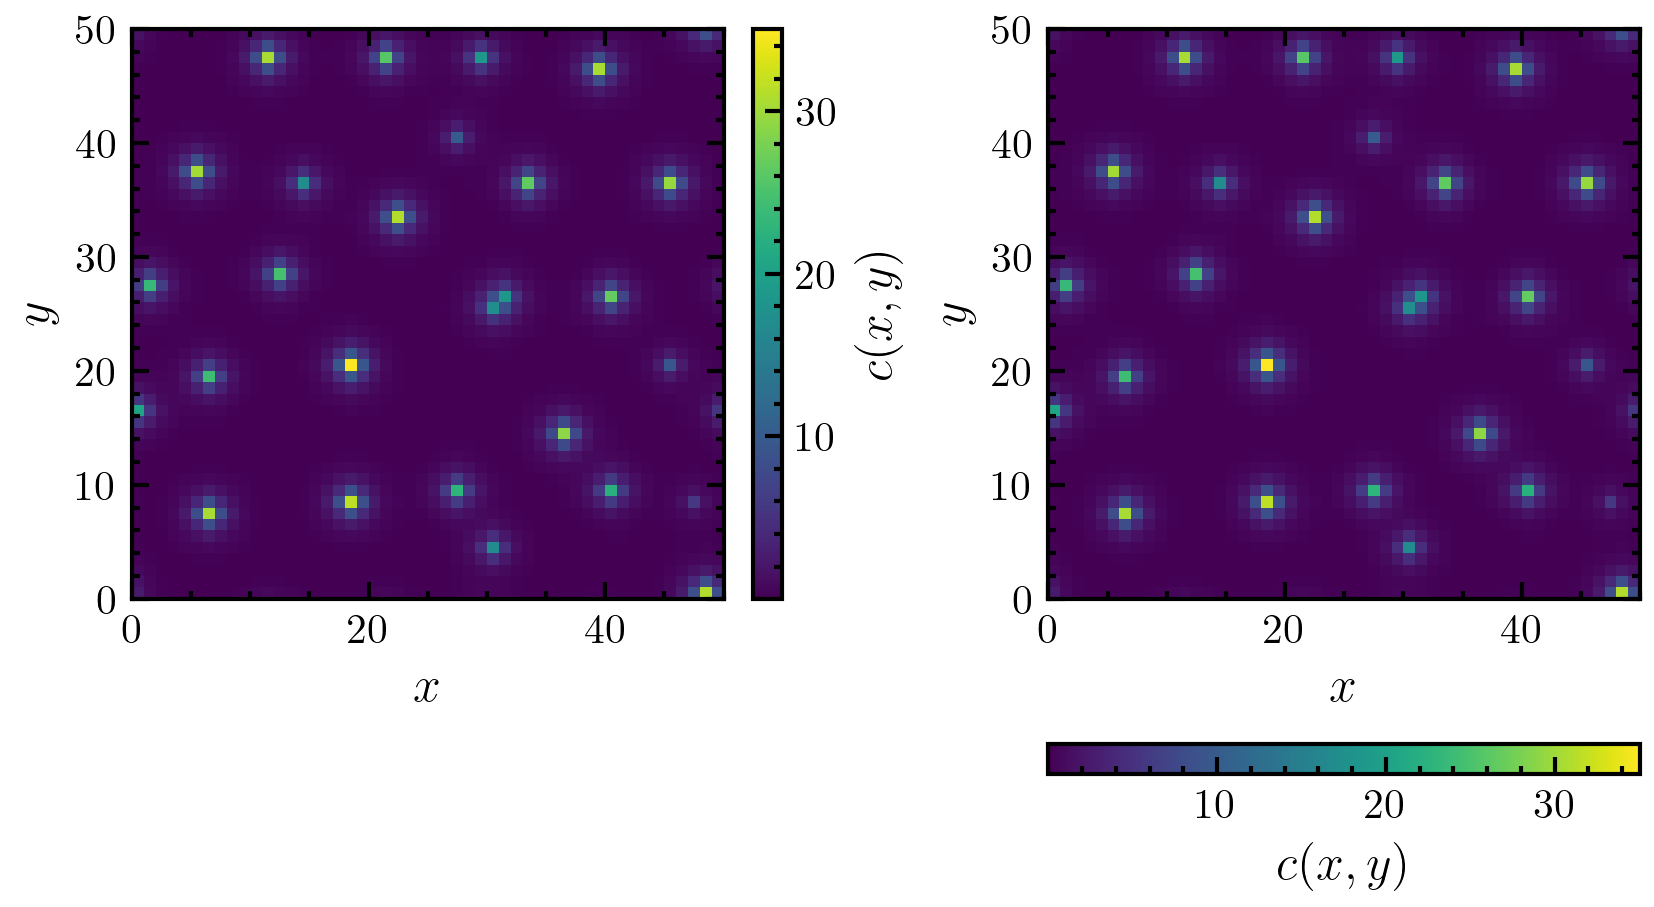
>>> fig, axs = amep.plot.new(figsize=(5.5,3), ncols=2)
>>> field1 = amep.plot.field(axs[0], C, X, Y, cmap='viridis')
>>> cax1 = amep.plot.add_colorbar(
...     fig, axs[0], field1, label=r'$c(x,y)$'
... )
>>> field2 = amep.plot.field(axs[1], C, X, Y, cmap='viridis')
>>> cax2 = amep.plot.add_colorbar(
...     fig, axs[1], field2, label=r'$c(x,y)$',
...     orientation='horizontal'
... )
>>> axs[0].set_xlabel(r'$x$')
>>> axs[0].set_ylabel(r'$y$')
>>> axs[1].set_xlabel(r'$x$')
>>> axs[1].set_ylabel(r'$y$')
>>> fig.savefig('./figures/plot/plot-add_colorbar_1.png')
>>>

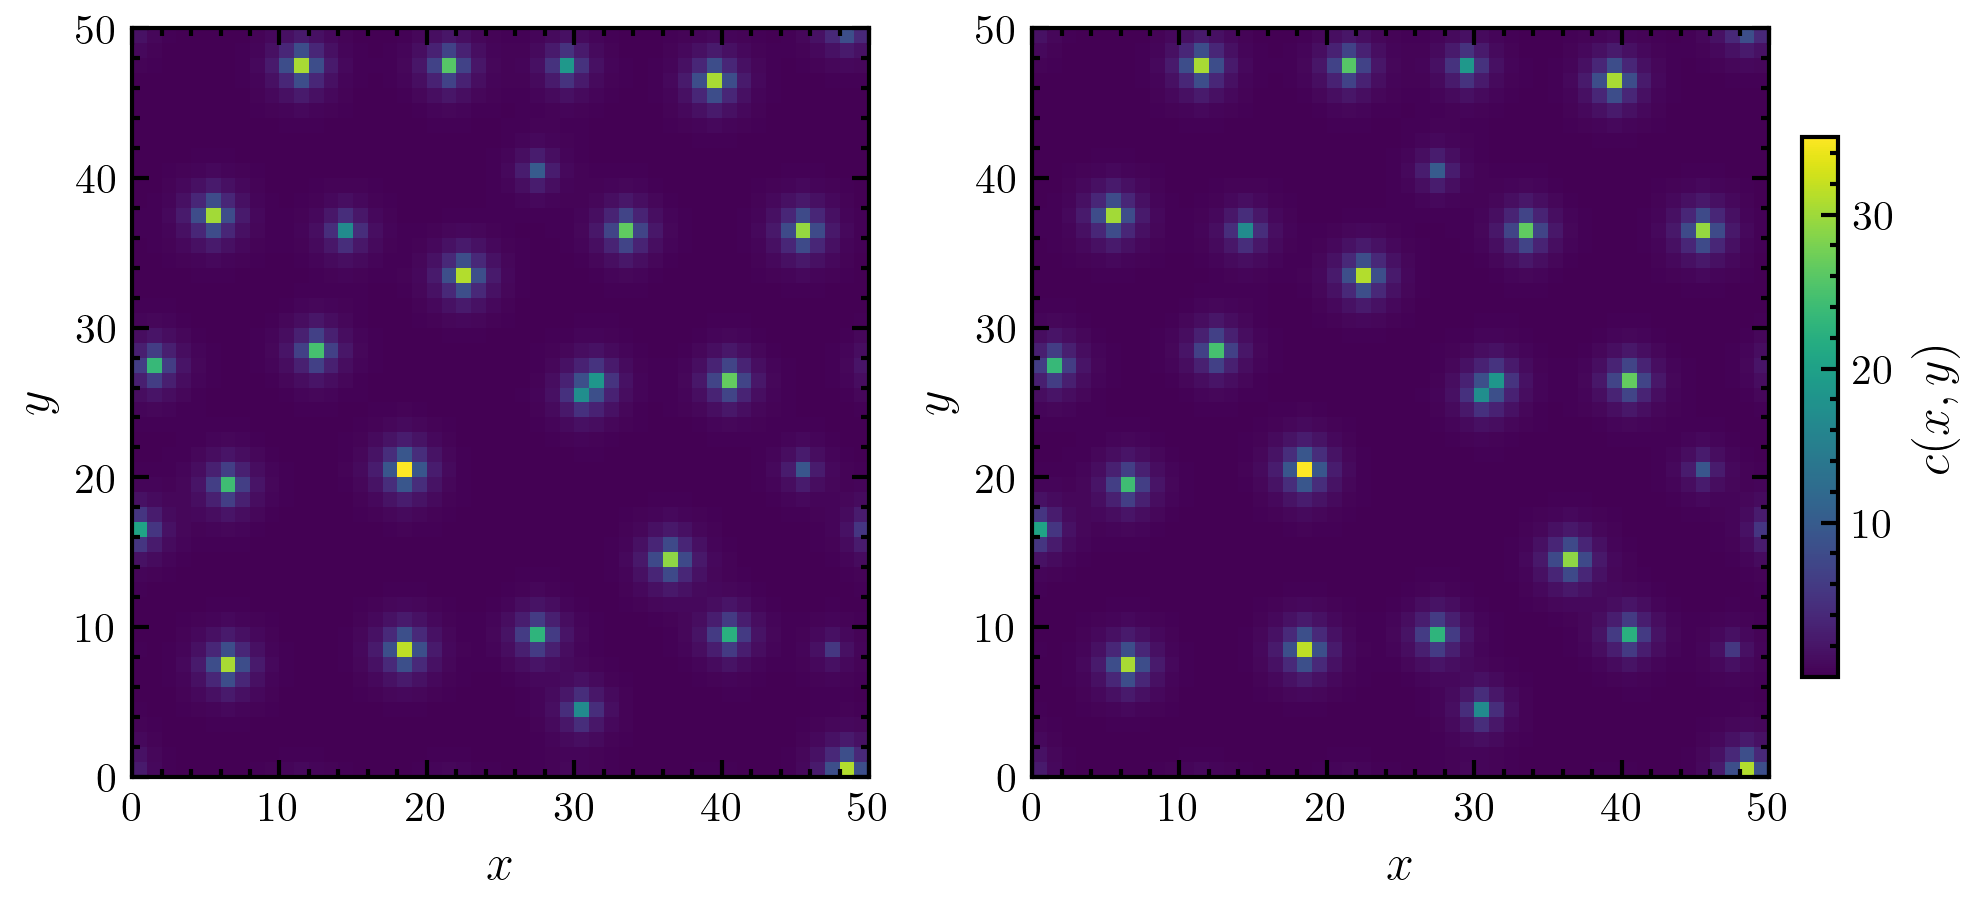
>>> fig, axs = amep.plot.new(figsize=(6,3), ncols=2)
>>> field1 = amep.plot.field(axs[0], C, X, Y, cmap='viridis')
>>> field2 = amep.plot.field(axs[1], C, X, Y, cmap='viridis')
>>> cax = amep.plot.add_colorbar(
...     fig, axs[1], field2, cax_extent = [1.0, 0.25, 0.02, 0.6],
...     label=r'$c(x,y)$'
... )
>>> axs[0].set_xlabel(r'$x$')
>>> axs[0].set_ylabel(r'$y$')
>>> axs[1].set_xlabel(r'$x$')
>>> axs[1].set_ylabel(r'$y$')
>>> fig.savefig('./figures/plot/plot-add_colorbar_2.png')
>>>

