amep.statistics.histogram2d#
- amep.statistics.histogram2d(xdata: ndarray, ydata: ndarray, xmin: float | None = None, xmax: float | None = None, ymin: float | None = None, ymax: float | None = None, nxbins: int | None = None, nybins: int | None = None, density: bool = True, xlogbins: bool = False, ylogbins: bool = False) tuple[ndarray, ndarray, ndarray]#
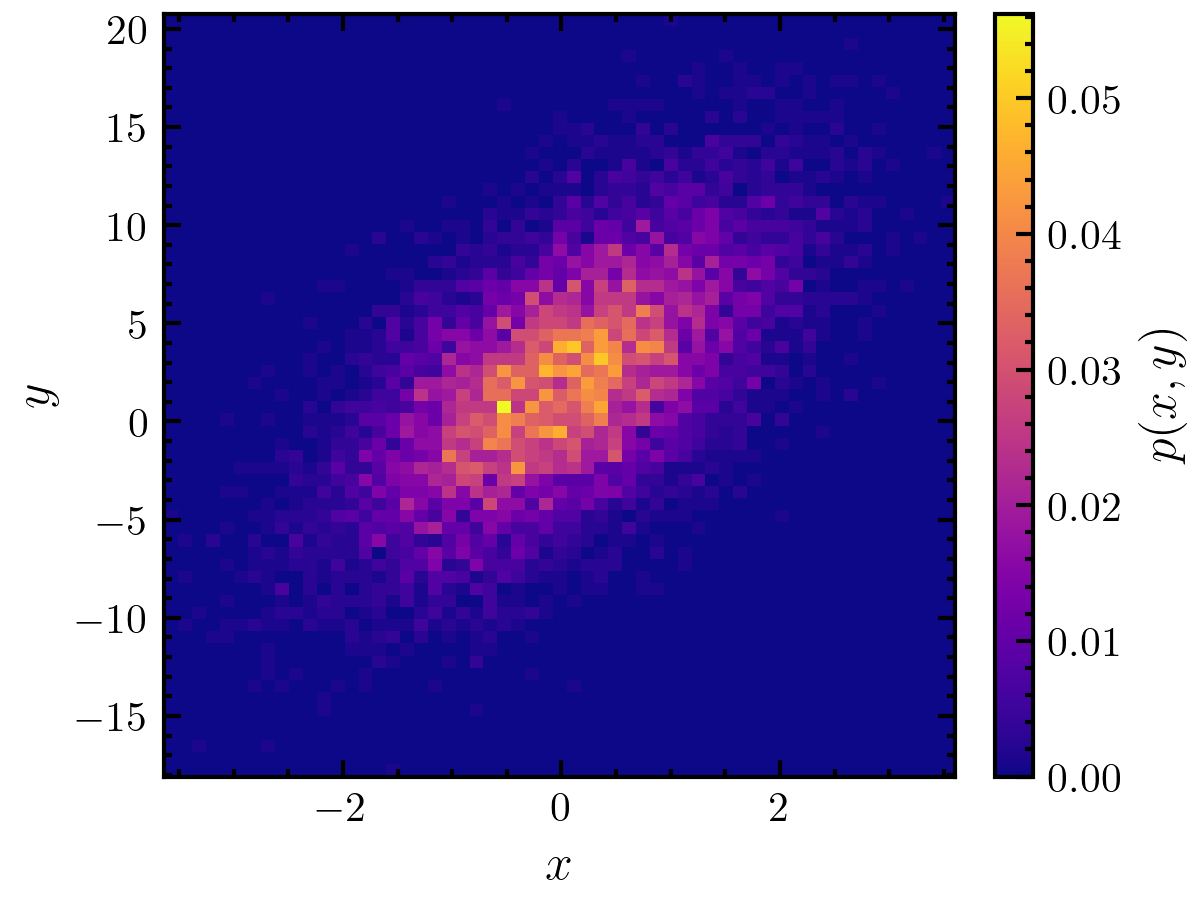
Calculates the two-dimensional distribution function of the given data from a 2d-histogram.
Notes
If the number of bins nbins is not given, the optimal number is estimated using the Freedman–Diaconis rule (see https://en.wikipedia.org/wiki/Freedman–Diaconis_rule or Ref. [1] for further information).
References
- Parameters:
xdata (np.ndarray) – Input data of first dimension.
ydata (np.ndarray) – Input data of second dimension.
xmin (float or None, optional) – Minimum value of the bins in first dimension. The default is None.
xmax (float or None, optional) – Maximum value of the bins in first dimension. The default is None.
ymin (float or None, optional) – Minimum value of the bins in second dimension. The default is None.
ymax (float or None, optional) – Maximum value of the bins in second dimension. The default is None.
nxbins (int or None, optional) – Number of bins in first dimension. The default is None.
nybins (int or None, optional) – Number of bins in second dimension. The default is None.
density (bool, optional) – If True, the distribution is normalized. If False, a simple histogram is returned. The default is True.
xlogbins (bool, optional) – If True, the bins are logarithmically spaced in the first dimension. Only possible when nxbins is given. The default is False.
ylogbins (bool, optional) – If True, the bins are logarithmically spaced in the second dimension. Only possible when nxbins is given. The default is False.
- Returns:
np.ndarray – Histogram/Distribution function.
np.ndarray – Bins.
Examples
>>> import amep
>>> import numpy as np
>>> n = 10000
>>> x = np.random.standard_normal(n)
>>> y = 2.0 + 3.0 * x + 4.0 * np.random.standard_normal(n)
>>> hist, xedges, yedges = amep.statistics.histogram2d(x, y)
>>> X,Y = np.meshgrid(xedges, yedges, indexing="ij")
>>> fig, axs = amep.plot.new()
>>> mp = amep.plot.field(axs, hist, X, Y)
>>> cax = amep.plot.add_colorbar(fig, axs, mp, label=r"$p(x,y)$")
>>> axs.set_xlabel(r"$x$")
>>> axs.set_ylabel(r"$y$")
>>> fig.savefig('./figures/statistics/statistics-histogram2d.png')
>>>

