amep.plot.format_axis#
- amep.plot.format_axis(axis: Axes | ndarray, which: str = 'both', axiscolor: str | None = None, axiswidth: float | None = None, ticks: bool = True, ticksbottom: bool | None = None, tickstop: bool | None = None, ticksleft: bool | None = None, ticksright: bool | None = None, direction: str | None = None, majorlength: int | None = None, minorlength: int | None = None, tickwidth: float | None = None, tickcolor: str | None = None, ticklabels: bool = True, ticklabelsize: int | None = None, ticklabelcolor: str | None = None, ticklabelpad: int | None = None, ticklabelbottom: bool | None = None, ticklabeltop: bool | None = None, ticklabelleft: bool | None = None, ticklabelright: bool | None = None, labels: bool = True, labelsize: int | None = None, labelcolor: str | None = None, xlabelloc: str | None = None, ylabelloc: str | None = None, titlesize: int | None = None, titlecolor: str | None = None, backgroundcolor: str | None = None, colors: str | None = None) None#
Format the given axis(axes) of the plot.
This method is a wrapper for various Matplotlib methods that allow to format one or multiple axis including the formatting of ticks, labels, and titles. The default of most keywords is None. In this case, the defaults from the plot style are used.
- Parameters:
axis (AxesSubplot or array of AxesSubplot objects) – Axis object to which the changes should be applied.
which (str, optional) – The axis (‘x’, ‘y’, or ‘both’) to which the changes should be applied. The default is ‘both’.
axiswidth (float or None, optional) – Axis width in points. The default is None.
axiscolor (str or None, optional) – Color of the axis lines. Is set to colors if colors is not None. The default is None.
tick (bool, optional) – Turns the ticks on and off. The default is True.
ticksbottom (bool or None, optional.) – Show ticks at the bottom. The default is None.
tickstop (bool or None, optional) – Show ticks at the top. The default is None.
ticksleft (bool or None, optional) – Show ticks at the left side. The default is None.
ticksright (bool or None, optional) – Show ticks at the right side. The default is None.
direction (str or None, optional) – Direction in which the ticks should point (‘in’ or ‘out’). The default is None.
majorlength (int or None, optional) – Length of the major ticks. The default is None.
minorlength (int or None, optional) – Length of the minor ticks. The default is None.
tickwidth (float or None, optional) – Tick width in points. The default is None.
tickcolor (str or None, optional) – Color of the ticks and tick labels. Is set to colors if colors is not None.The default is None.
ticklabels (bool, optional) – Turns the tick labels on and off. The default is True.
ticklabelsize (int or None, optional) – Size of the tick labels. The default is None.
ticklabelcolor (str or None, optional) – Color of the tick labels. Is set to colors if colors is not None. The default is None.
ticklabelpad (float or None, optional) – Distance in points between tick and label. The default is None.
ticklabelbottom (bool or None, optional) – Show tick labels at the bottom. The default is None.
ticklabeltop (bool or None, optional) – Show tick labels at the top. The default is None.
ticklabelleft (bool or None, optional) – Show tick labels at the left side. The default is None.
ticklabelright (bool, optional) – Show tick labels at the right side. The default is None.
labels (bool, optional) – Turns the axis labels on and off. The default is True.
labelsize (int or None, optional) – Size of the axis labels. The default is None.
labelcolor (str or None, optional) – Color of the axis labels. Is set to colors if colors is not None. The default is None.
xlabelloc (str or None, optional) – Location of the x label (‘top’ or ‘bottom’). The default is None.
ylabelloc (str or None, optional) – Location of the y label (‘left’ or ‘right’). The default is None.
titlesize (int or None, optional) – Size of the title. The default is None.
titlecolor (int or None, optional) – Color of the title. Is set to colors if colors is not None. The default is None.
background (str or None, optional) – Background color of the plot. The default is None.
colors (str or None, optional) – If not None, this color is used for titlecolor, axiscolor, tickcolor, labelcolor, and ticklabelcolor. The default is None.
- Return type:
None.
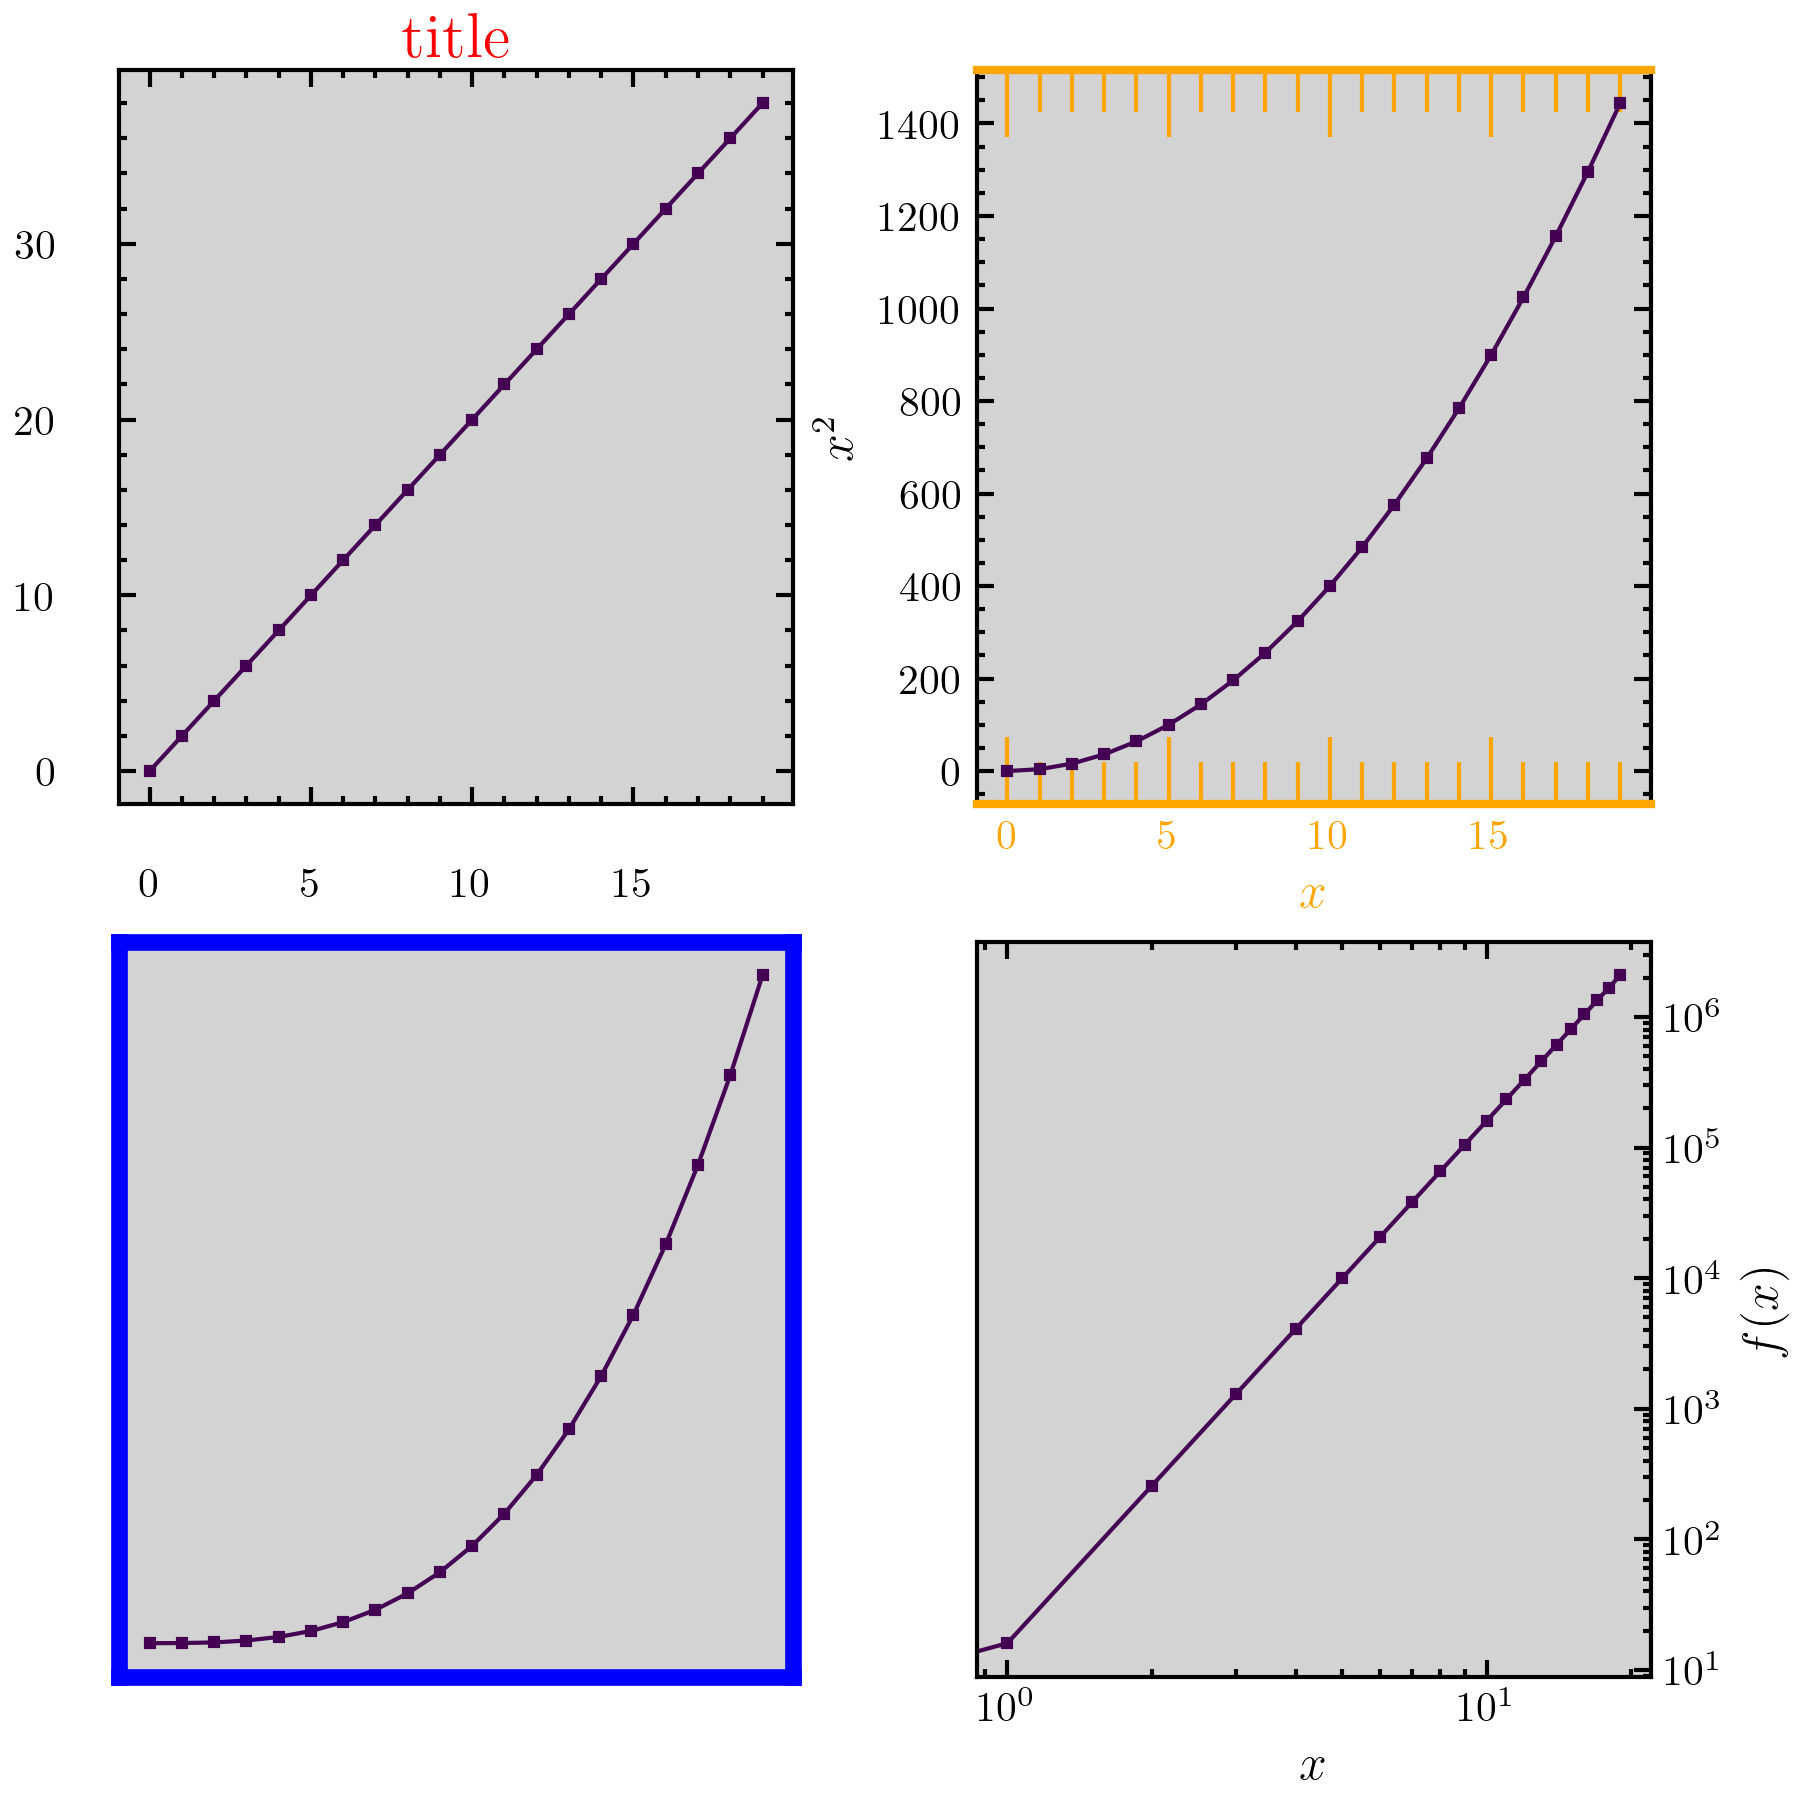
Examples
>>> import amep
>>> import numpy as np
>>> fig, axs = amep.plot.new(nrows=2, ncols=2, figsize=(6,6))
>>> axs = axs.flatten()
>>> x = np.arange(20)
>>> y = 2*x
>>> for i,ax in enumerate(axs):
...     ax.plot(x, y**(i+1))
>>> axs[0].set_title('title')
>>> axs[1].set_xlabel(r'$x$'); axs[1].set_ylabel(r'$x^2$')
>>> axs[3].set_xlabel(r'$x$'); axs[3].set_ylabel(r'$f(x)$')
>>> axs[3].loglog()
>>> amep.plot.format_axis(
...     axs[0], titlesize=15, titlecolor='red',
...     ticklabelpad=15
... )
>>> amep.plot.format_axis(
...     axs[1], which='x', majorlength=16, minorlength=10,
...     axiswidth=2, colors='orange'
... )
>>> amep.plot.format_axis(
...     axs[2], ticks=False, ticklabels=False,
...     axiswidth=4, axiscolor='blue'
... )
>>> amep.plot.format_axis(
...     axs[3], which='y', ylabelloc='right', ticklabelleft=False,
...     ticklabelright=True, ticksleft=False, tickstop=False
... )
>>> amep.plot.format_axis(
...     axs, backgroundcolor='lightgray'
... )
>>> fig.savefig('./figures/plot/plot-format_axis.png')
>>>

