amep.utils.detect2peaks#
- amep.utils.detect2peaks(xdata: ndarray, ydata: ndarray, nav: int = 11, distance: int = 8, height: float = 0.1, width: int = 4) tuple[list, list, ndarray, ndarray]#
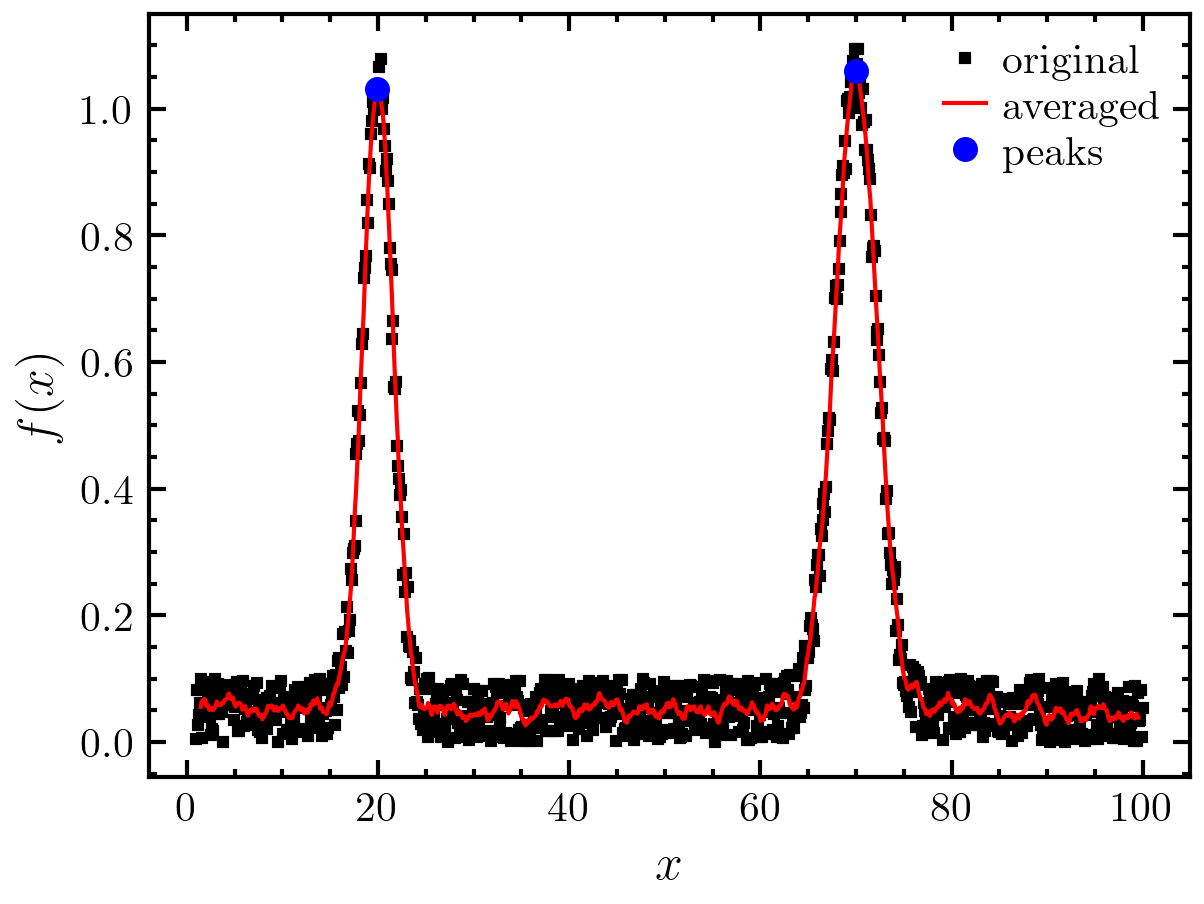
Detects the two highest peaks in the given data after smoothing it with a running average. Includes also global maxima at the boundaries.
- Parameters:
xdata (np.ndarray) – x values as 1D array of floats.
ydata (np.ndarray) – y values as 1D array of floats (same shape as xdata).
nav (int, optional) – Number of points to average over via running mean. The default is 11.
distance (int, optional) – Minimum distance in samples between two peaks. The default is 8.
height (float, optional) – Minium height of a peak. The default is 0.1.
width (int, optional) – Minimum peak width in samples. The default is 4.
- Returns:
low (list) – Coordinates [x,y] of the peak at smaller x value.
high (list) – Coordinates [x,y] of the peak at larger x value.
avydata (np.ndarray) – Averaged y values.
avxdata (np.ndarray) – Averaged x values (same shape as avxdata).
Examples
>>> import amep
>>> import numpy as np
>>> x = np.linspace(1,100,1000)
>>> y = np.exp(-(x-20)**2/5)
>>> y += np.exp(-(x-70)**2/10)
>>> y += np.random.rand(len(x))*0.1
>>> low, high, avy, avx = amep.utils.detect2peaks(
...     x, y, nav=10, width=2
... )
>>> fig, axs = amep.plot.new()
>>> axs.plot(x, y, label='original', c='k', ls='')
>>> axs.plot(avx, avy, label='averaged', c='r', marker='')
>>> axs.plot(
...     low[0], low[1], linestyle='', marker='.',
...     c='b', markersize=10, label='peaks'
... )
>>> axs.plot(
...     high[0], high[1], linestyle='',
...     marker='.', c='b', markersize=10
... )
>>> axs.legend()
>>> axs.set_xlabel(r'$x$')
>>> axs.set_ylabel(r'$f(x)$')
>>> fig.savefig('./figures/utils/utils-detect2peaks.png')
>>>

